To send reports periodically, it is necessary to configure a schedule and assign recipients to these reports. This page provides a detailed explanation of how to set a schedule. Information about adding and managing recipients is available on the Recipients page. For a complete overview of the required settings for scheduling a report, you can look at the chapter Overview.
¶ Schedule report
To schedule a report periodically, you can follow the following steps:
- Click on the [Add] button
- Enter a Name for the report
- Select the report type (see Reporting types for more information)
- Optionally adjust the Email text (see Email text below for more information)
- Select the desired frequency (see Frequencies for more information)
- Click [Next]
- Select the meters for which the report should be generated
- Click [Save]

¶ Email text
Every schedule has an Email text field. This is the accompanying message that is sent in the e-mail along with the report. The field is prefilled with our standard text:
Bijgevoegd vindt u het laatste rapport: $reportName.
De informatie in het rapport gaat over de periode van $periodStart tot en met $periodEnd.
The report e-mails are sent in Dutch only, so both the standard text and any text you enter here are shown to the recipient in Dutch.
You can change this text, for example to explain to the recipient why the report is being sent (such as a legal obligation for an EBS report). If you leave the field on the standard text or clear it, the standard e-mail text is used automatically. The placeholders $reportName, $periodStart and $periodEnd are automatically replaced when the e-mail is sent with the report name and the start and end date of the period, respectively.
¶ Overview
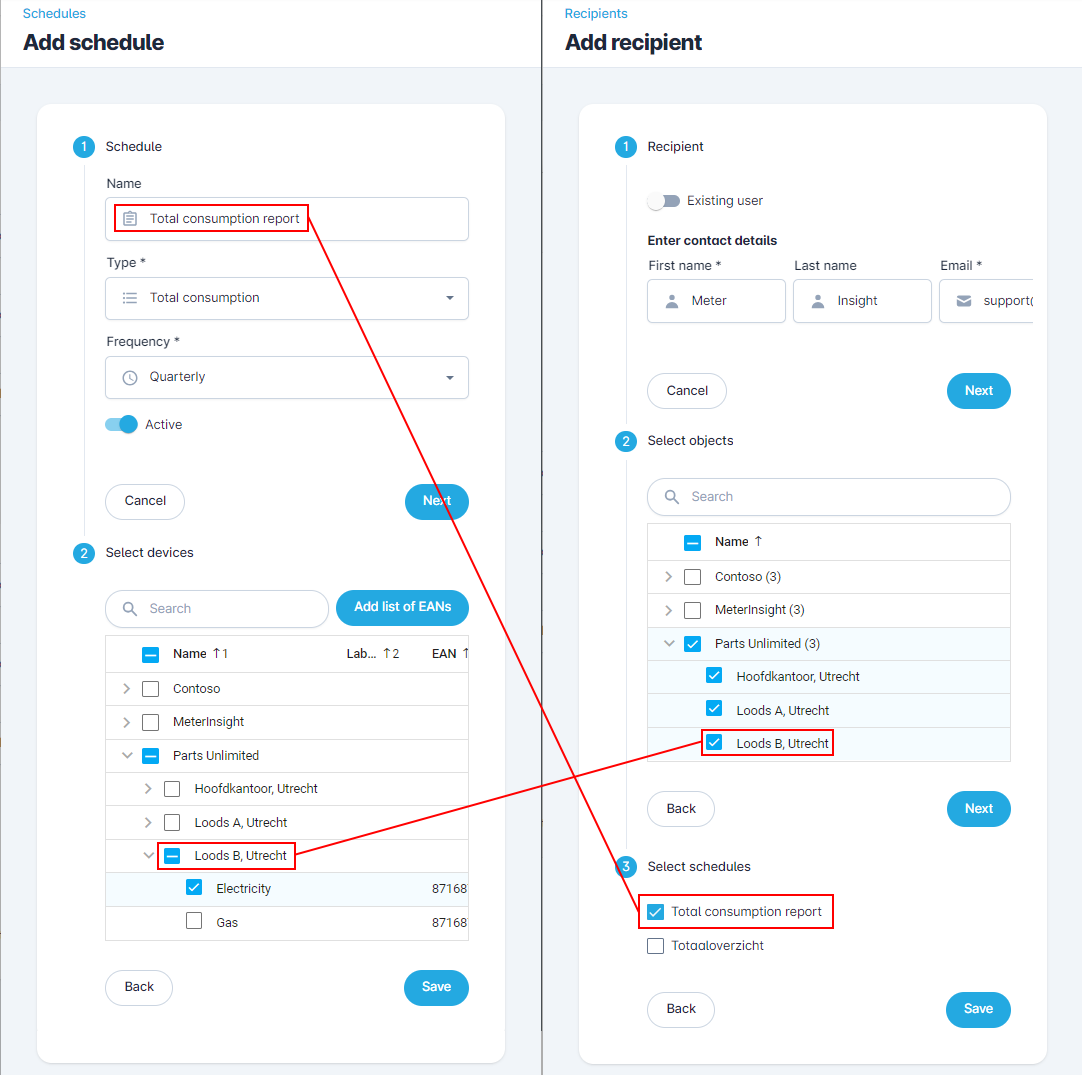
It is not enough to just create a schedule. It is also necessary to create recipients for the relevant schedule. To provide insight into the required settings, below is an example screenshot of both settings. The two settings that are important to keep an eye on are connected by red lines:
- The first setting is the link between the planning and the reports that the recipient may receive. In this example, the recipient may receive the "Total consumption report" report, but not the "Invoice simulation" report.
- The second setting is the link between the selected meters and the associated objects. In this example, one meter has been selected in the planning under the object "Loods B". Because the recipient says "Parts Unlimited B.V." if object is selected, the recipient will also receive reports for "Loods B".
¶ Frequencies
Each report type has one or more adjustable frequencies:
- Weekly: Send a report for the previous week. This report will be sent on Monday (at the earliest) if the data for the previous week is available. If not all data is available after two days, the report will be sent with incomplete data.
- Monthly
- Quarterly
- Semi-annually
- Yearly
The monthly, quarterly, semi-annually, and annual frequencies are sent on the first day of the new period (at the earliest) if the data for the previous period is available. If not all data is available after four days, the report will be sent with incomplete data.
¶ View sent reports
If you click on the history icon ( ) next to a schedule, a page will open with the reports already sent. The recipient is listed here with the associated report. The "Status" column and the "Sent on" column provide insight into whether a report has already been sent to the recipient. If the "Generated on" column contains a date, you can also download the generated report here.
The last option is to regenerate a report. This can be useful, for example, if new data has become available.
¶ Regenerate report
It is possible to regenerate an already generated report and have it sent. This can be done in the overview of the reports already sent.
Here it is possible to manually resend a report to a user with the same settings as the previously sent report. It is also possible to send the report not to the recipient, but to yourself.
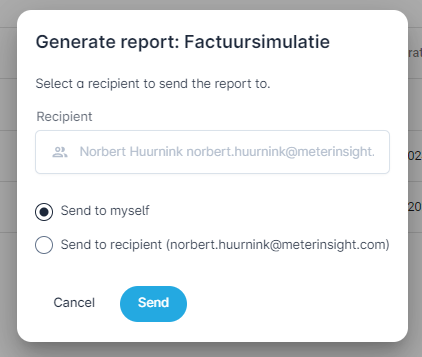
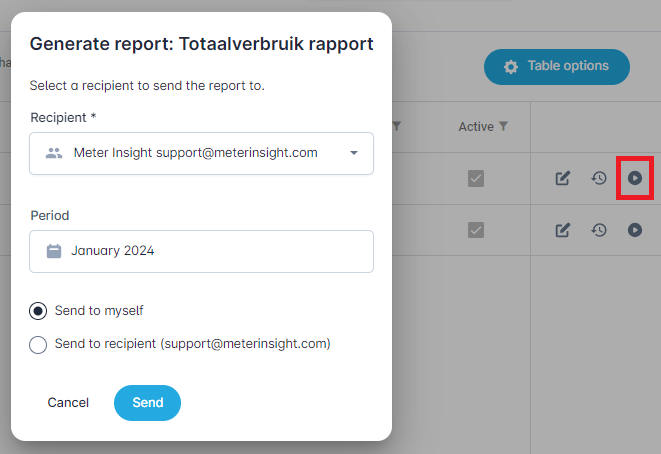
¶ Generate report once
It is possible to run a report once. If you click on the play icon next to a schedule, a screen will open to send a one-time report. Here it is possible to manually send a report to a user for a certain period. It is also possible to send the report not to the recipient, but to yourself. This way you can generate a report that will be sent during the next shipment.
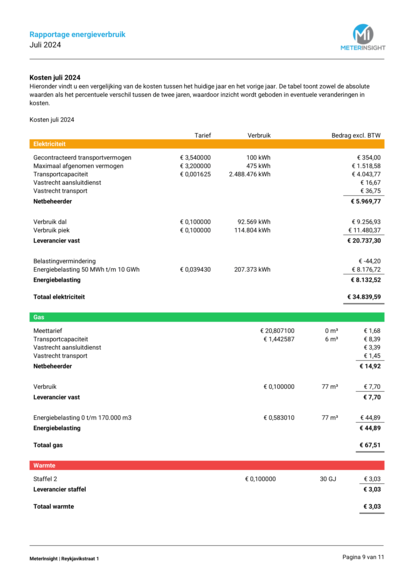
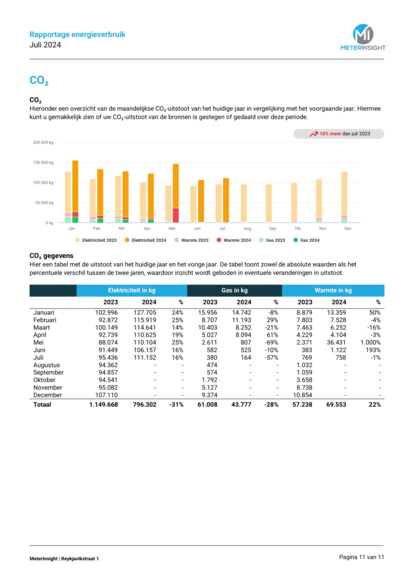
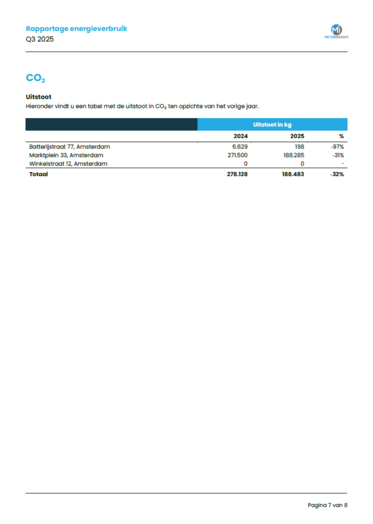
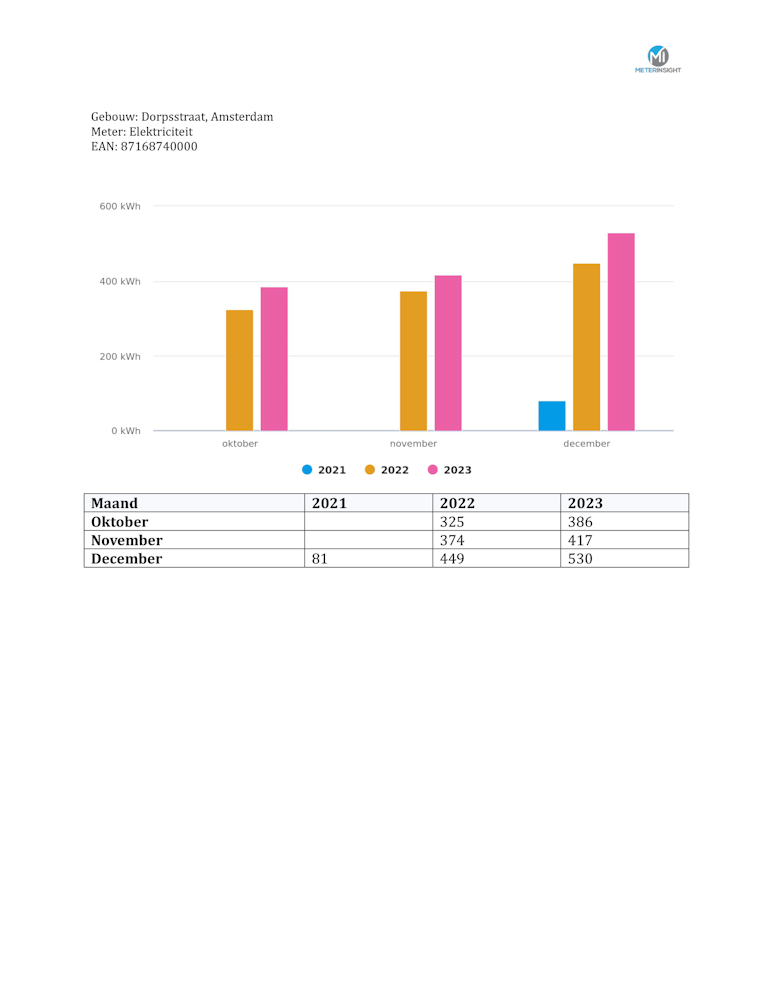
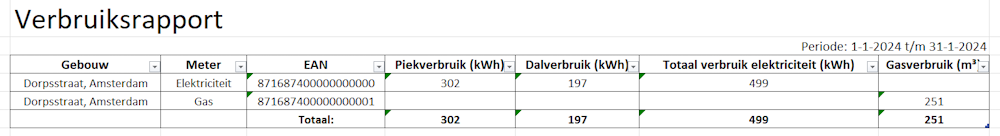
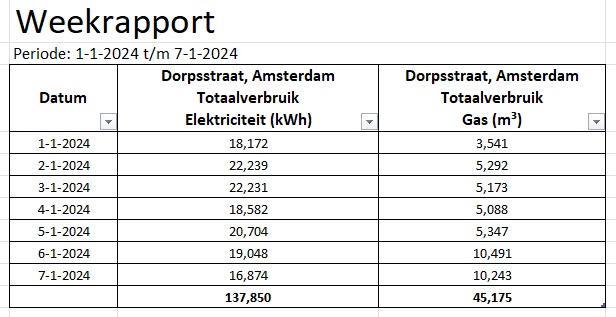
¶ Building report
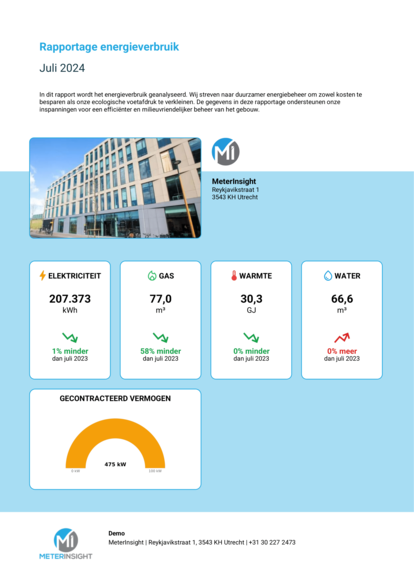
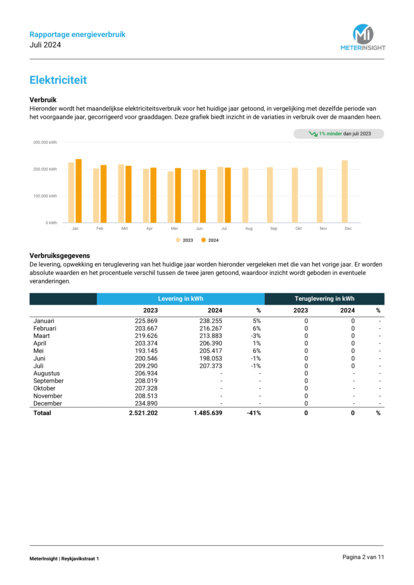
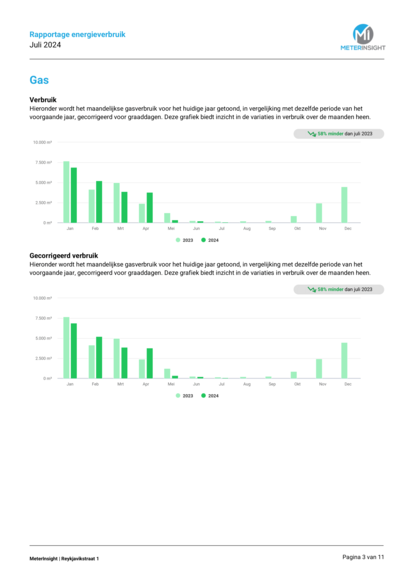
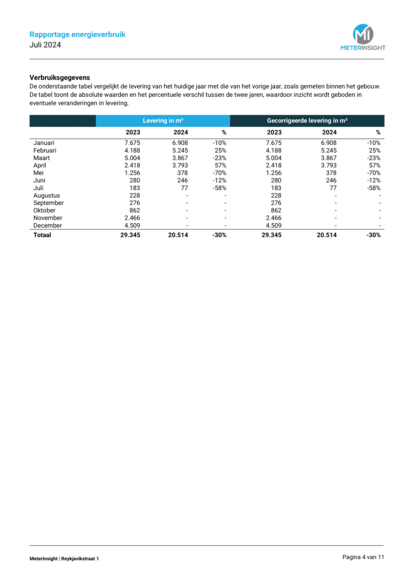
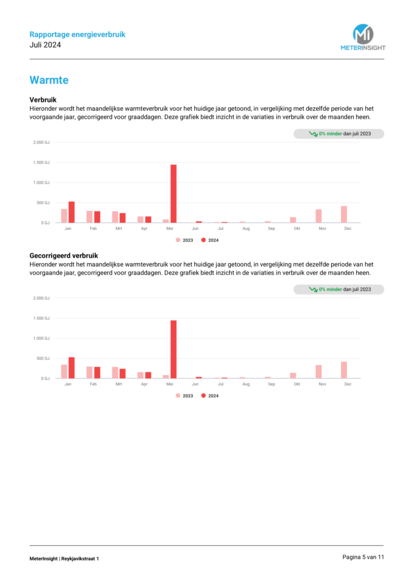
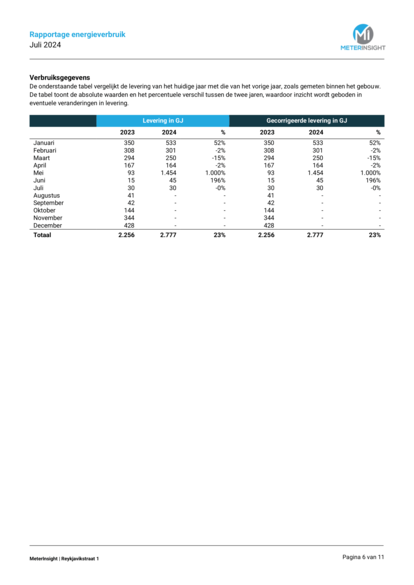
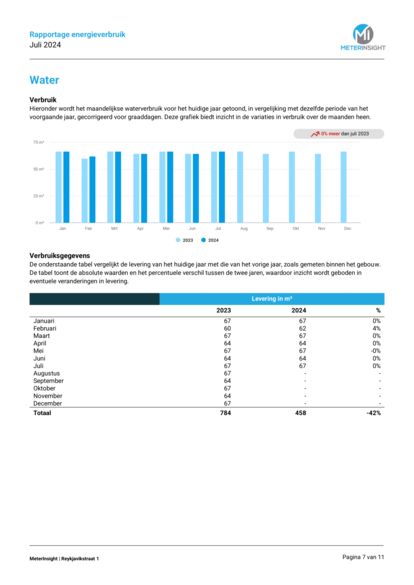
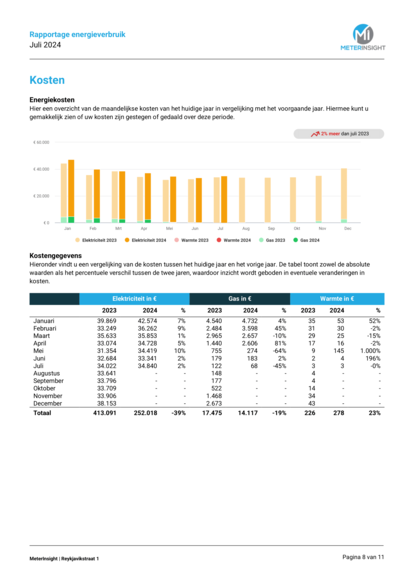
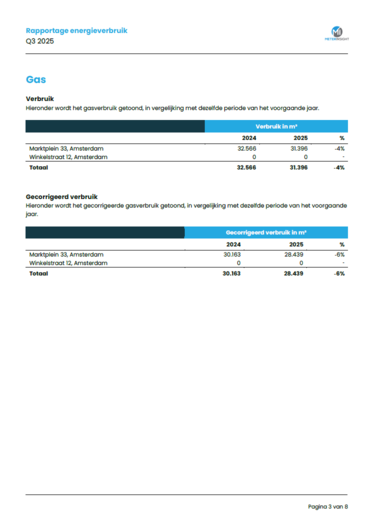
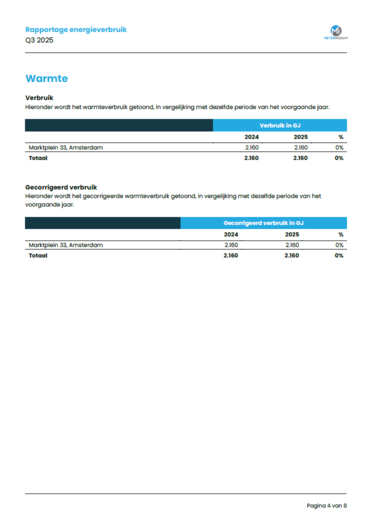
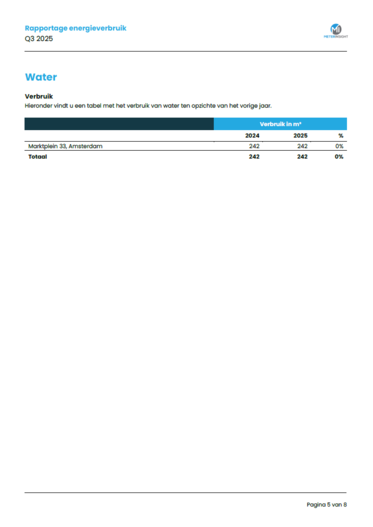
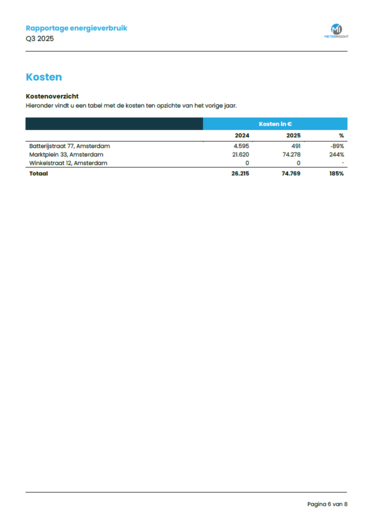
The building report is a report that can be sent monthly, quarterly or annually. This report shows the consumption of electricity, gas, heat, cold and water for a building or object. You can add a photo for each building or object, which will be shown on the first page of the report. The report can be sent completely whitelabeled, which means that the report can be customized with your own colors, font and logo.
| Property | Required | Type | Description |
|---|---|---|---|
| Report title | Yes | Text | The title of the report that is displayed at the top left of every page. Example: "Energy consumption report" |
| Report introduction | Yes | Text | The introductory text that is displayed at the top of the front page |
| Front page footer title | No | Text | The footer title. By default, this is the name of your company |
| Front page footer subtext | No | Text | The footer that is displayed next to your logo and below your company name. Example: "MeterInsight | Reykjavikstraat 1, 3543 KH Utrecht | +31 30 227 2473" |
| Benchmark years | No | List of years | The years you want to benchmark with. By default, this is the previous year, but it is also possible to select fixed years here. This can be useful if, for example, you want to ignore a year or if you want to set a fixed benchmark year. |
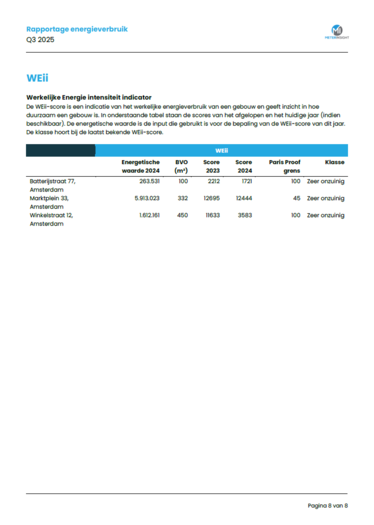
¶ WEii
When a WEii score is available for the building, the building report includes a dedicated WEii page. This page is only added when the WEii score can be calculated. The WEii score is an indication of the real energy usage of a building and gives insight into how sustainable it is. You can find more background on the WEii score and its calculation under the multisite report.
The building report itself is generated in Dutch, so the labels on the WEii page below are shown in Dutch.
The WEii page contains:
- A WEii score chart, with the key figures shown next to it:
- Weii – the building's WEii score for the reporting year, in kWh/m².
- Weii-finaal – the final WEii score, in kWh/m².
- Weii-verschil – the percentage difference compared to the previous year (only shown when both years are available).
- The building properties used for the calculation:
- Oppervlakte (floor area)
- Gebruiksfunctie uit bouwbesluit (building function from the building decree)
- Gebruikstype WEii (WEii usage type)
- The "Werkelijke Energie intensiteit indicator" table, which breaks down the regular WEii score. For each energy product (electricity, gas, heat, cold and water) it lists the energy consumption (Energieverbruik), the conversion factor (Conversiefactor), the weighting factor (Weegfactor) and the actual energy use (Werkelijk energieverbruik). Where applicable, delivery (Levering) and return (Teruglevering) are shown as separate rows. The summary rows at the bottom show Klimaatcorrectie, Totaal energieverbruik, Oppervlakte and the resulting WEii score. The climate correction adjusts the energy use for weather influences compared to an average year.
- The "Werkelijke Energie intensiteit indicator (Finaal)" table, with the same structure for the final WEii score (Weii-finaal), which also includes production.
Example of building report
 |
 |
 |
 |
 |
 |
 |
 |
 |
 |
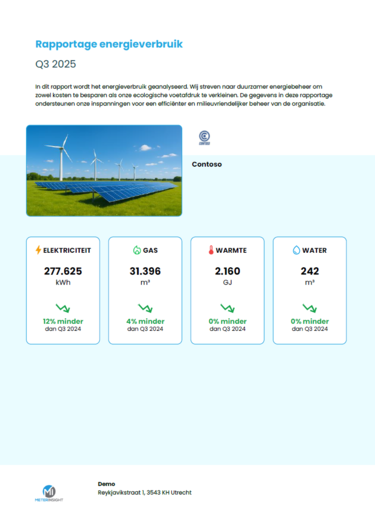
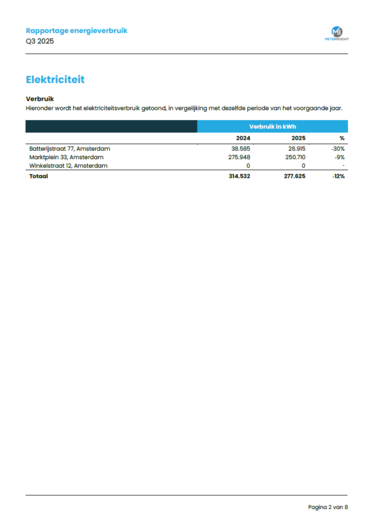
¶ Multisite report
The multisite report can be sent monthly, quarterly, semi-annually, or annually. This report shows the consumption of electricity, gas, heating, cooling, and water for multiple buildings or objects within an organization. You can add a logo for each organization, which will be displayed on the first page of the report. The report can be sent fully white-labeled, meaning it can be customized with your own colors, font, and logo.
| Property | Required | Type | Description |
|---|---|---|---|
| Report per | Yes | Picklist | The level at which the report should be generated, e.g., "Organization" or "Location" |
| Report title | Yes | Text | The title of the report, displayed at the top left of each page. Example: "Energy consumption report" |
| Report introduction | Yes | Text | The introductory text displayed at the top of the front page |
| Front page footer title | No | Text | The footer title. This is your company name by default. |
| Front page footer subtext | No | Text | The footer text that will appear next to your logo and below your company name. Example: "MeterInsight | Reykjavikstraat 1, 3543 KH Utrecht | +31 30 227 2473" |
¶ WEii
In the multisite report is a page of buildings with their WEii scores. The WEii score is an indication of the real energy usage of a building and gives insight in the sustainability level of a building.
The scores are calculated through the WEii API and are calculated per year.
The following building properties are required for calculation:
- Address
- Surface area
- Building type
- Delivery (required), return (optional) and production (optional) for an entire year
The score is calculated through the following formula:
WEii = (Delivery - Return - ExcludedEnergy - WeatherCorrectionFactor * Production + HeatingCorrectionFactor * HeatingEnergy) / UsableFloorspace
Both the ExcludedEnergy and the HeatingEnergy are currently not adjustable in out portal.
The weather corrections are performed to compare the score across years. These corrections can be positive or negative, but are always approximately 0.
More information about the calculation: https://www.weii.nl/protocol-26
Example of multisite report
 |
 |
 |
 |
 |
 |
 |
 |
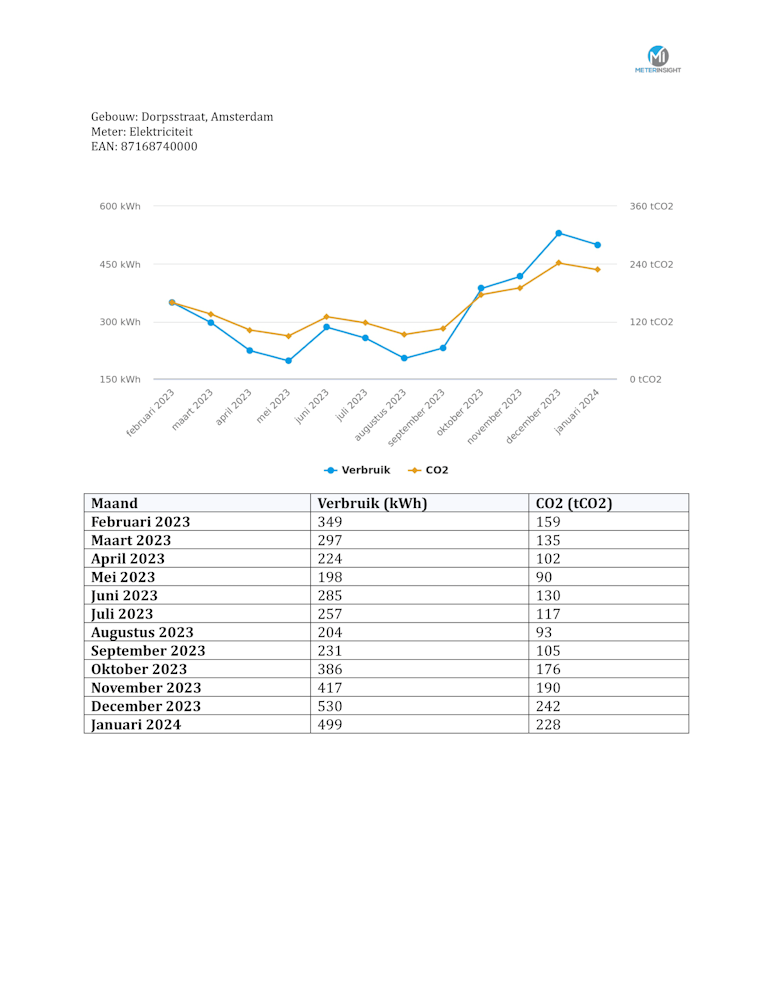
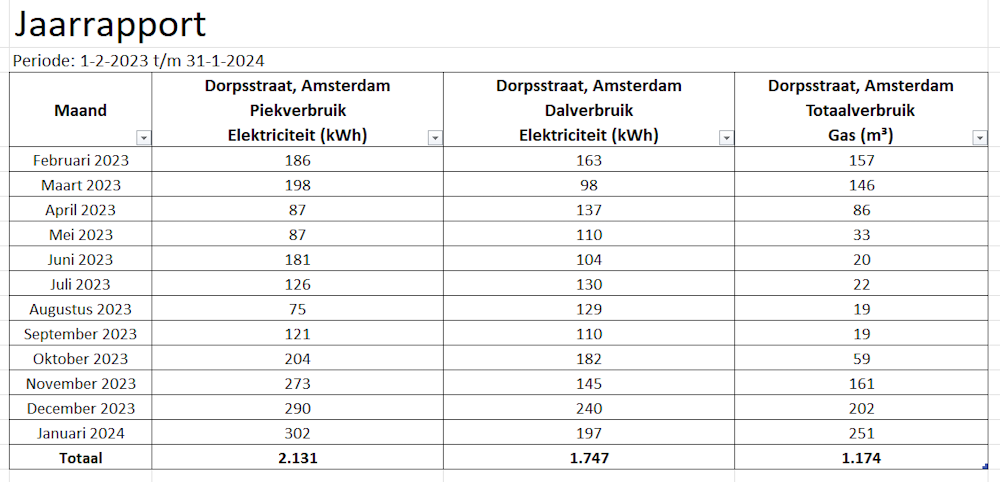
¶ Analysis report types
To give an impression of the different reporting types, the tabs below can be used to view a screenshot of an example report. The format of the resulting document is also indicated for each report (e.g. xlsx or pdf).
Format: pdf
Format: xlsx
Format: pdf
Format: xlsx
Format: xlsx
Format: pdf
Format: xlsx