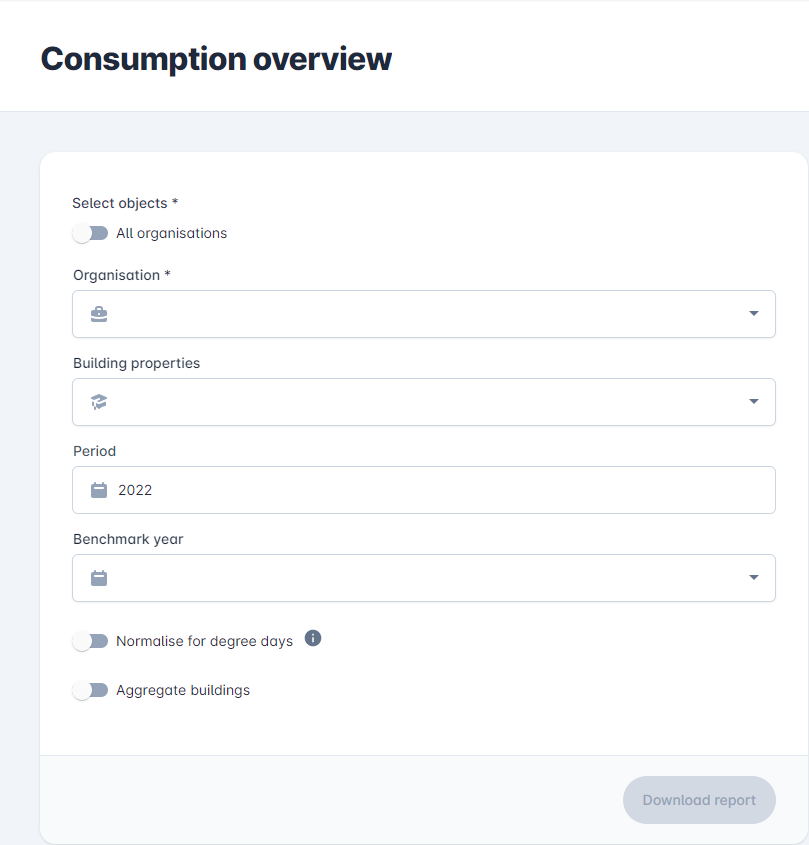
¶ Select object(s)
To download a consumption overview, click on the menu item "Consumption overview" under "Reports". You first have to select a few options, you can select all organisations or choose to select a specific organisation or building. This can be done using the dropdown menu's. You then choose which building properties should be displayed.
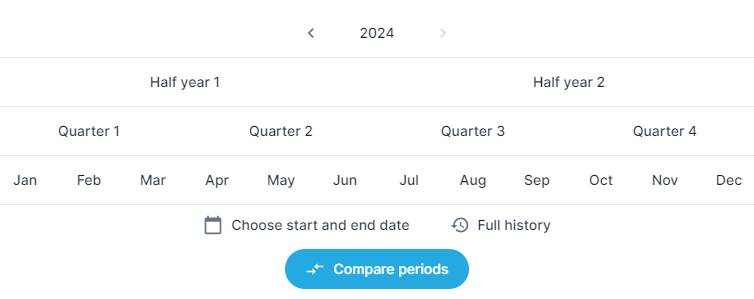
¶ Select period
The next step is to select the period for which consumption overview should show data. The default setting is the current year. When you click on it, a dialog opens as shown below.
¶ Choose additional options
Finally, you can choose whether to select a benchmark year. In that case, it also shows the dates of that year in a separate column, in addition to those of the selected period. You can enable normalization on degree days, so that the influence of weather conditions is ignored. You can also choose to aggregate buildings so that all values are added together.
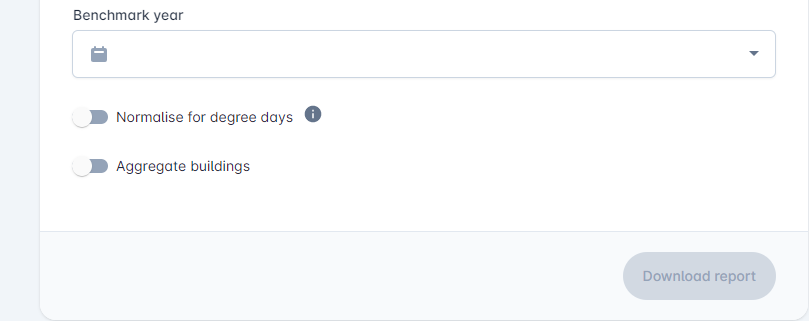
¶ Download report
Once the object(s) and the period is selected, you're ready to download the report by clicking the "Download report" button as shown below.

This will generate an Excel file with the start and end meter readings for the selected period of all selected meters.
